
Metadata Update Frequency: Compare to Your Category!
We are proud to announce that there is a new addition to AppTweak’s Timeline feature! The Update Frequency Benchmark will help you understand how often the top apps in your category update their metadata. Furthermore, you can now easily compare your app’s update frequency to your competitors.
AppTweak allows you to take your metadata update strategy to a whole new level!
Competitor View: Understand Different Strategies
Find out which metadata competitors update the most
As an app, it is important to benchmark yourself against other apps in your industry. Thanks to AppTweak’s new Update Frequency Benchmark, you can now compare your app’s update strategy with others.
Discover our step-by-step guide to getting started with ASO
Once you have selected a peer group you think is comparable, you can discover which competitors update their app more frequently, and which nearly never update their app. Then, we show you the number of updates that happened during a period of time, according to the date range selected.
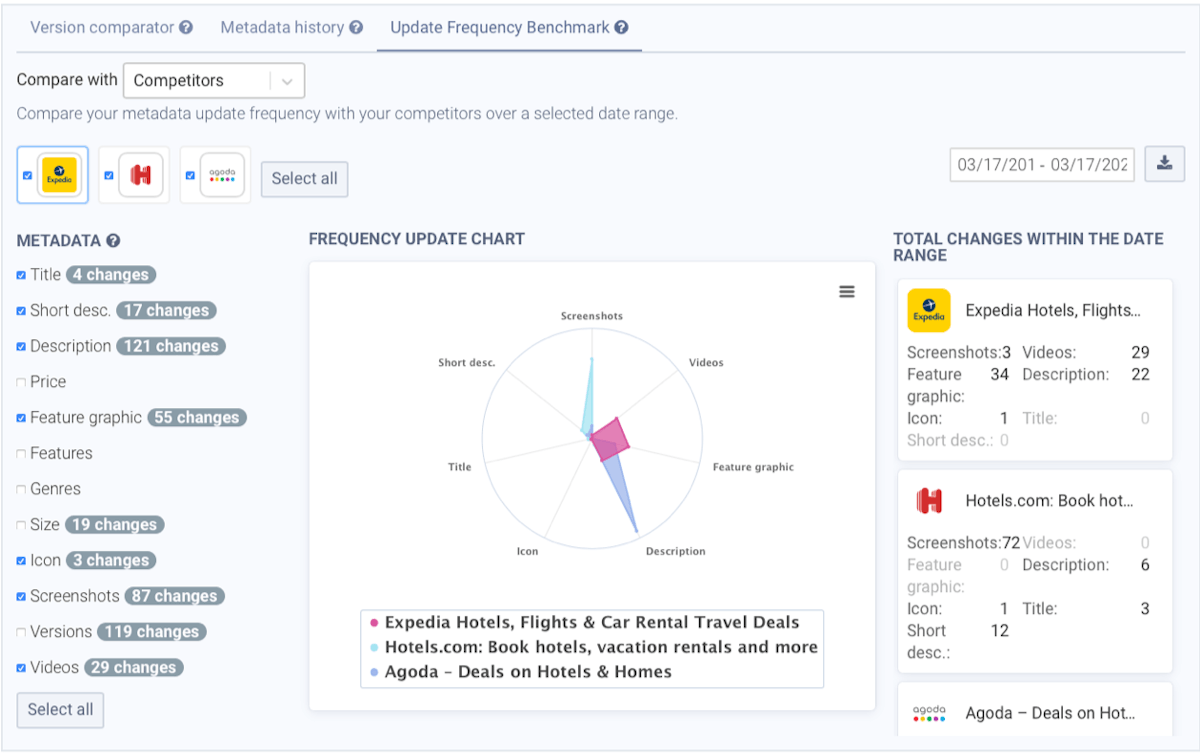
Here, we chose the app Expedia and compared it to 2 other booking apps (Hotels.com & Agoda). As we can see, we can directly pinpoint which app is implementing a different strategy. Indeed, Expedia is putting more effort into updating its feature graphic and videos, while Agoda is more focused on changing its long description and Hotels.com, its screenshots.
Three different strategies are displayed here. If we click on the metadata history, we can then see exactly what changes were made by Hotels.com & Agoda.
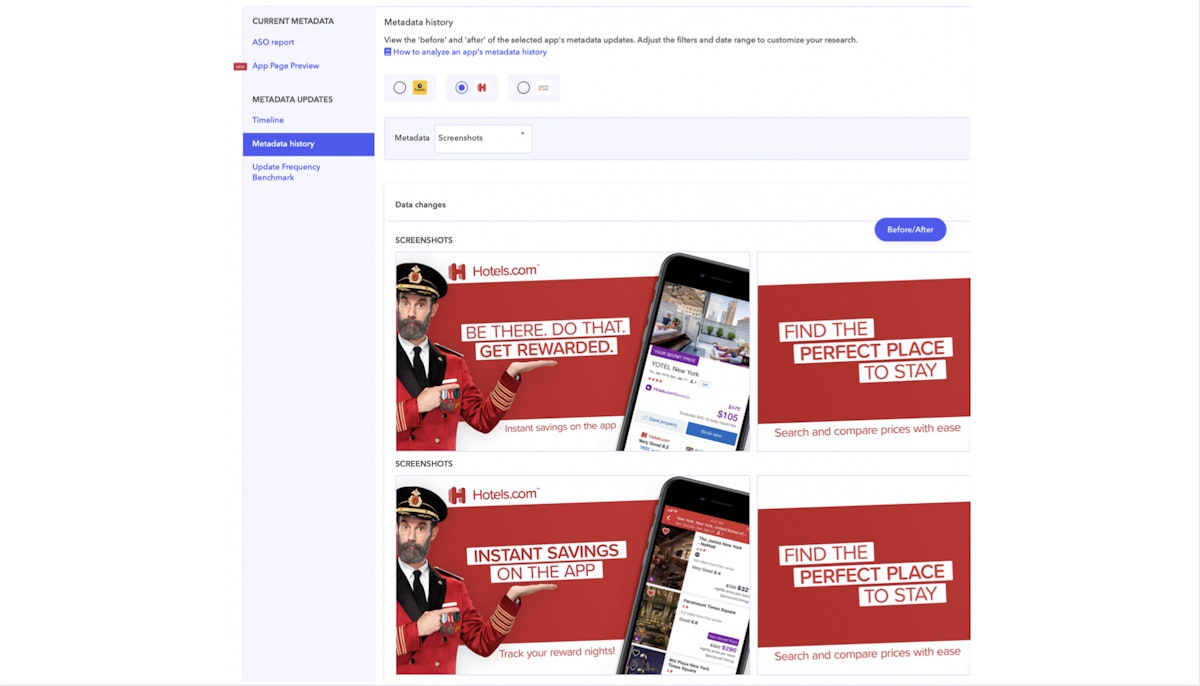 Here, for instance, we can see that Hotels.com regularly changed its screenshots by A/B testing small details of the picture such as the phone screen or the slogan. On average, Hotels.com changes or A/B tests its screenshots every month; as a result, you can see the last versions they updated for each month and learn what worked for them and what did not.
Learn how often you should update your metadata
Spy on competitors’ seasonal update strategies
Thanks to AppTweak, you can also quickly understand what happens during specific events or seasons. We show you a representation per selected period of what your competitors are doing in terms of updates.
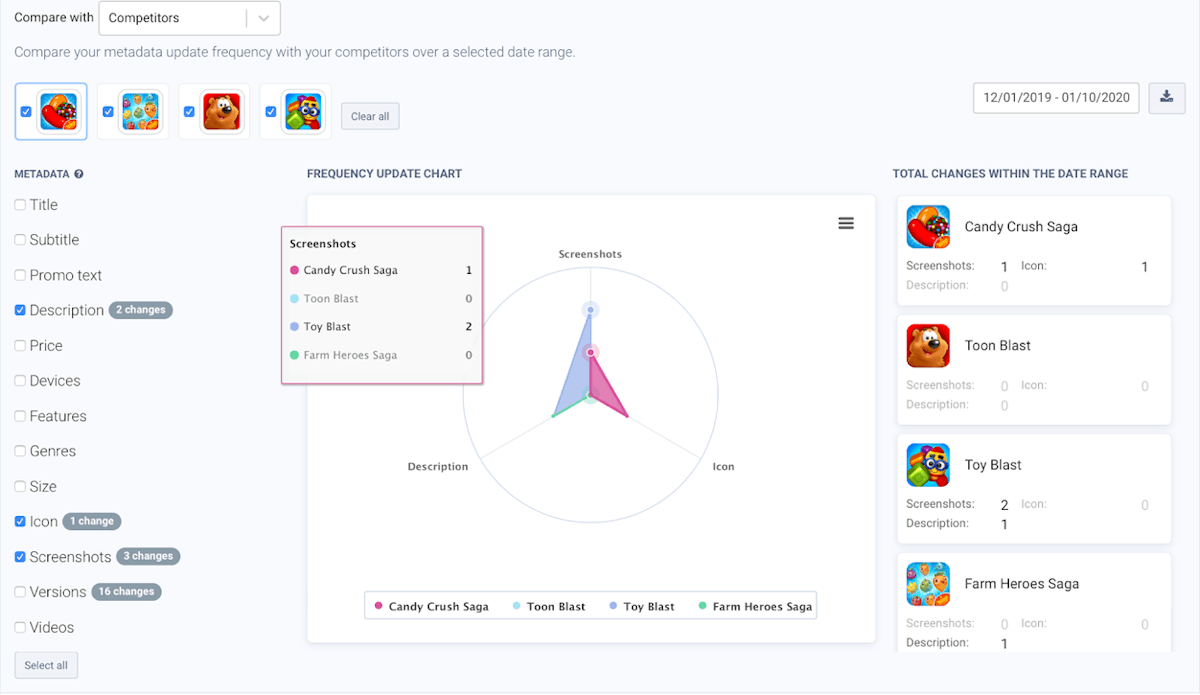
Here, we see an example from Candy Crush during the Christmas period and we selected three other gaming apps (Toon Blast, Farm Heroes Saga, and Toy Blast). Using this chart, you can directly pinpoint the only metadata they focus on – screenshots, icon, and description. Moreover, we identify two different update strategies: on the one hand, Toy Blast’s strategy shows more effort put into screenshots and description; on the other hand, Candy Crush is more focused on changing their icon and screenshots. In addition, it is very informative to see that Toy Blast implements the most updates in terms of screenshots, while Toon Blast does nothing at all.
These two combinations can help you understand what your competitors are doing and, by going back to the Timeline or the Metadata history, you can see if you have updated at the same time as your competitor or differentiated yourself.
Want to discover our general guidelines on developing an effective ASO strategy? Read this blog!
Benchmark: Ahead or Behind the Category?
You may be wondering if you could compare your metadata update strategy to a broader, maybe more representative, sample. This is why we developed another view, the Category Benchmark view, which enables you to compare your metadata updates to the top downloaded apps of your category.
Identify metadata update trends in your category
If you want to see what your category is doing over the course of one year, you can switch to the Benchmark view. In this section, you can see if your strategy is aligned with the rest of the category.
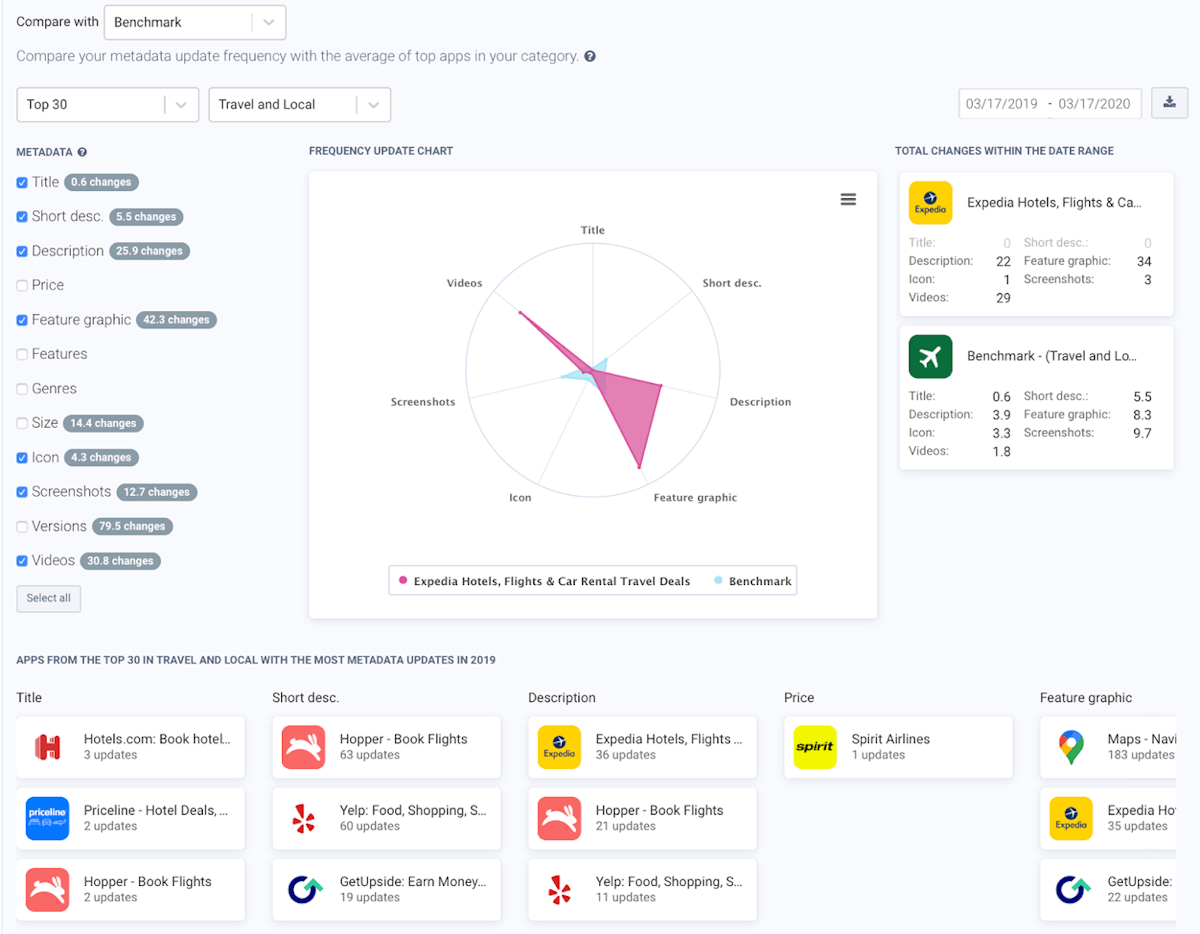
Here, we took the example of Expedia, which belongs to the category “Travel and Local”. As previously demonstrated, Expedia focuses more on changing its feature graphic, description, and videos. However, with our spider graph, we can quickly see that the category does not have the same approach. Instead, more effort is put into screenshots and the short description.
From this insight, you can adapt your strategy and see what others are doing with their metadata, and perhaps follow the same trends. But how do you get ideas to improve your update strategy? Read the section below to figure this out!
Learn from the best
We added a table below the graph showing the apps that change their metadata most often in your category. This can be very useful if you want to find inspiration in their updates.

In the screenshot above, we show that Expedia could get inspiration for its short description by looking at apps that put more effort into updating this metadata. You can also see that Hopper effectuated 60 updates in 2019. It could be a good idea to check these updates out and learn from their tests!
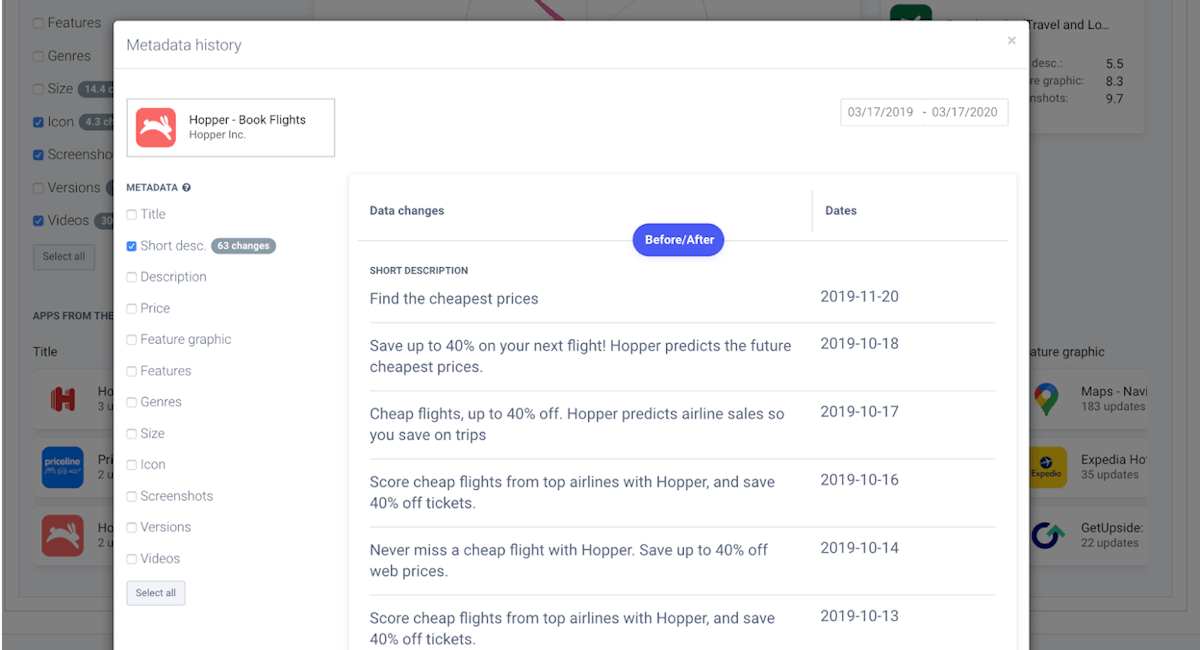
You simply need to click on the icon to see the metadata history; don’t hesitate to learn from these top downloaded apps.
Calculation method
Depending on the number of top apps you have selected in your category (top 5, 10, or 30), we compute the average number of updates for these top apps, which is what you see represented on the spider graph.
Moreover, the total metadata changes represent the addition of your metadata updates throughout the year and the average of your category in 2019.
Finally, the benchmark is calculated over the fixed period of 2019. Therefore, when you change the date range, we will show you the data for your app during the date range selected. For the benchmark, we take the information for 2019 and extrapolate the data on the same date range. As a result, you can compare similar situations. However, we recommend looking at a minimum of 3 months for a good understanding of the situation.
Start fine-tuning your strategy! The Update Frequency Benchmark feature will help you in many ways. It gives you quick and understandable information that will help you make strategic decisions. Here is a summary of what is waiting for you:
- Identify the different metadata strategies of your competitors
- See if they adjust their strategy during specific events/seasons
- Identify trends in your category
- Learn from the best apps in your category
Don’t hesitate to try out our new feature!


 Georgia Shepherd


 Olivier Verdin

 Jonathan Frisch

