
6 Ways to Use Reporting Studio to Measure App Performance
Reporting is essential to mobile marketing; the most successful app and game companies regularly evaluate the impact and ROI (return on investment) of their efforts and adjust their strategies accordingly.
However, with so many acquisition channels and data sources available for mobile businesses, it’s rarely easy – and almost always time-consuming – to effectively visualize the results of your various projects. That’s why we’ve developed Reporting Studio, a platform allowing you to plot data across sources to build powerful app performance reports.
With Reporting Studio, have personalized reports for your team’s goals always at your fingertips. Reporting Studio allows you to save valuable time and increase your team’s efficiency with graphs and integrations that automatically stay up-to-date (instead of needing new files or data uploaded every week or month).
To help you get the most out of Reporting Studio, below you’ll find a few examples of reports you can easily build and share with stakeholders to prove the impact of your app growth work.
Reporting Studio is available with an AppTweak Enterprise plan.
1. Compare real app downloads to competitor estimates
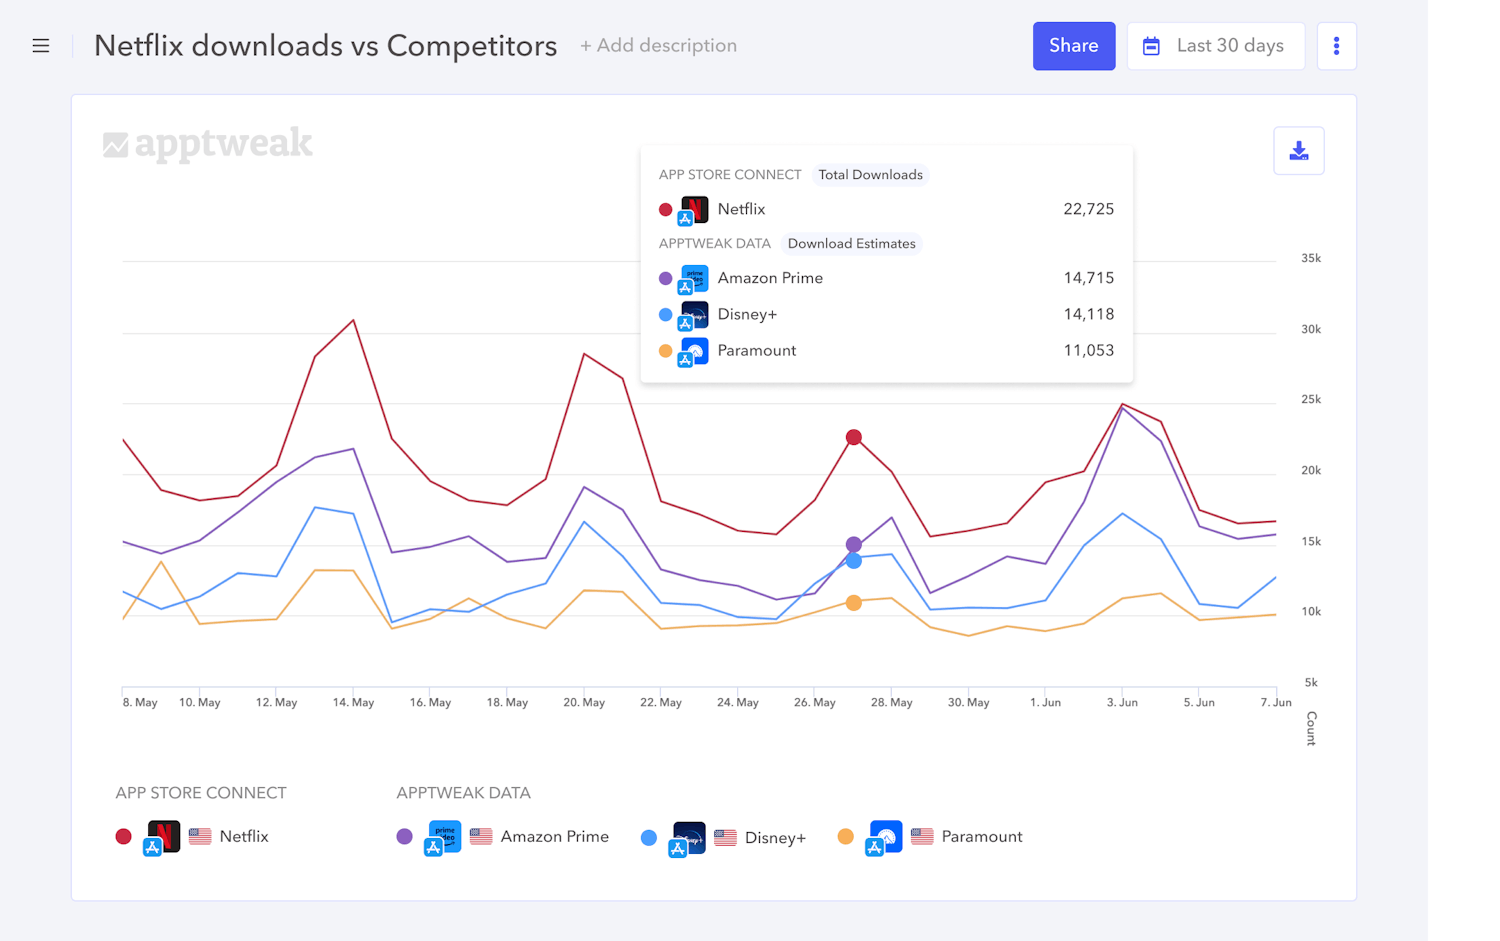
With Reporting Studio, plot your real downloads from App Store Connect or Google Play Console against our AI-powered download estimates for any app or game.
For instance, the report below took seconds to set up but would be very useful to spot competitors’ increased marketing efforts and provide new insights to help adapt your own strategy.
2. Keep an eye on App Store vs. Google Play category ranking
If you focus your efforts on a single market, Reporting Studio will allow you to centralize your store performance in one simple view. For example, quickly plot your category ranking across different devices (iPhone, iPad, or Android) to better understand differences between the stores, their competitors, user behaviors, and more.

3. Track keyword volume & search popularity across countries
Keyword volume is a KPI between 5 and 100 that measures the search popularity of a specific keyword. Given its normalized scale, it becomes interesting for app marketers to compare keyword volumes across countries: for instance, to monitor the popularity of your brand keywords in different markets.
Learn more about keyword volume & other important KPIs to select the best keywords
A cross-country view of your branded keyword volumes will help you understand if your brand is stable, getting stronger, or getting weaker in your countries of interest. You’ll be able to identify interesting peaks or troughs, prioritize efforts in specific markets, and more accurately analyze the impact of your brand campaigns or other external factors.

For example, the graph above shows the keyword volume evolution for “mcdonalds” in the UK, Australia, France, the US, and Spain. While the brand’s search popularity has remained rather stable over the past year in the US, we can easily identify spikes in its popularity in the UK and other countries.
It would be interesting to then dig deeper into the different marketing campaigns or seasonality effects that might have boosted users’ search interest around the same time.
4. Monitor & compare brand awareness with competitors
Staying on the topic of keyword volume, it would also be interesting to compare search popularity for your brand vs. competitors. Comparing the branded keyword volumes of top apps and games in your market will allow you to quickly understand brand awareness and interest in specific countries.
Identify your most relevant competitors with AppDNA & GameDNA
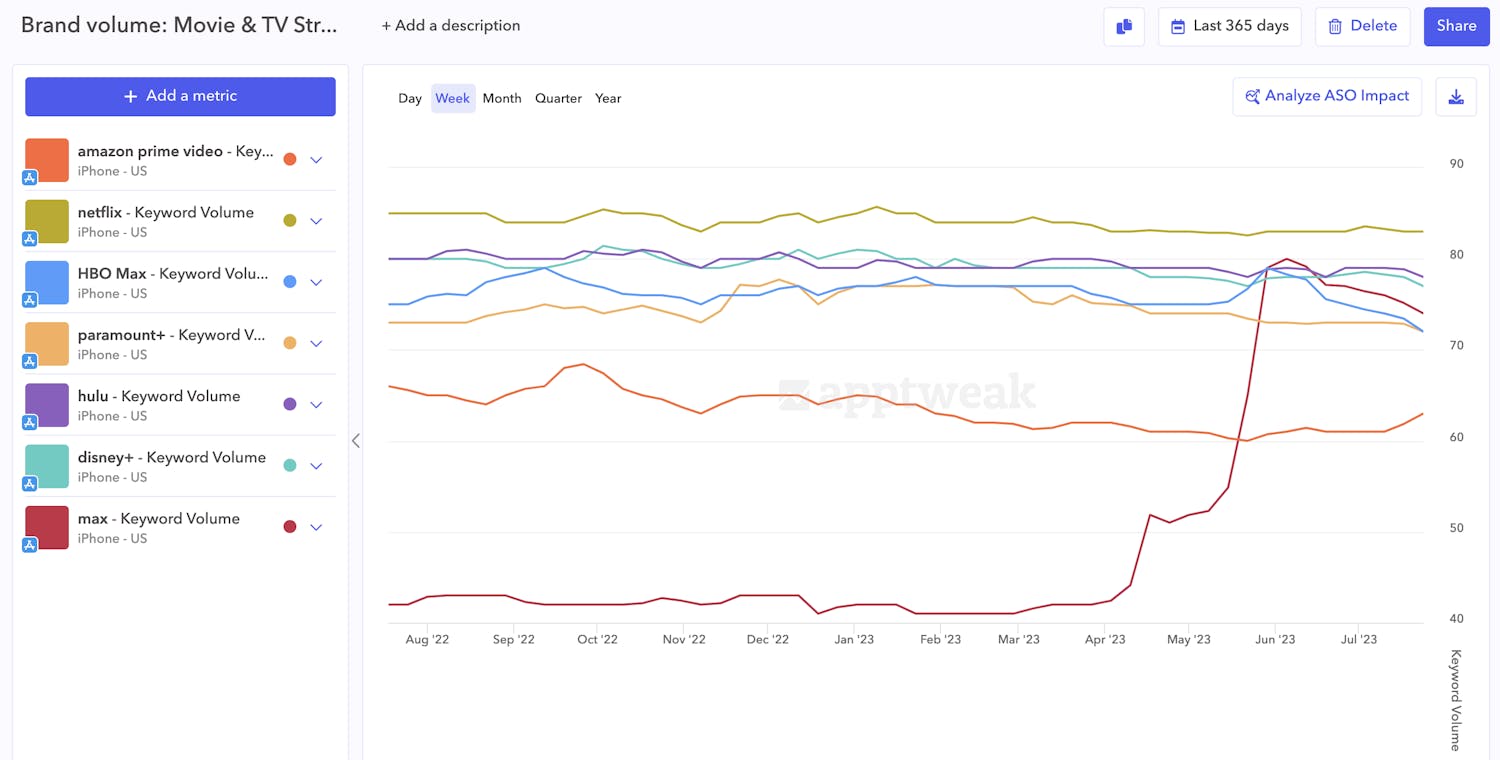
For instance, analyzing the popularity of Movie & TV Streaming apps in the US emphasizes Netflix’s long-standing status as market leader. At the same time, we see the huge impact of the launch of Max (formerly HBO Max) at the end of May, with the app momentarily surpassing Hulu and Disney+ in App Store searches.
Expert Tip
When comparing keyword volumes, remember that search popularity grows exponentially. This means the search difference between brands at the top end of the scale (e.g. between volume 80 vs. 81) is greater than the difference between brands at the lower end (e.g. 60 vs. 61).5. Measure organic uplift of Apple Search Ads campaigns
Already running Apple Search Ads campaigns on target keywords? To ensure a complete growth strategy, it’s a good idea to compare the paid install performance of your target keywords with their organic performance.
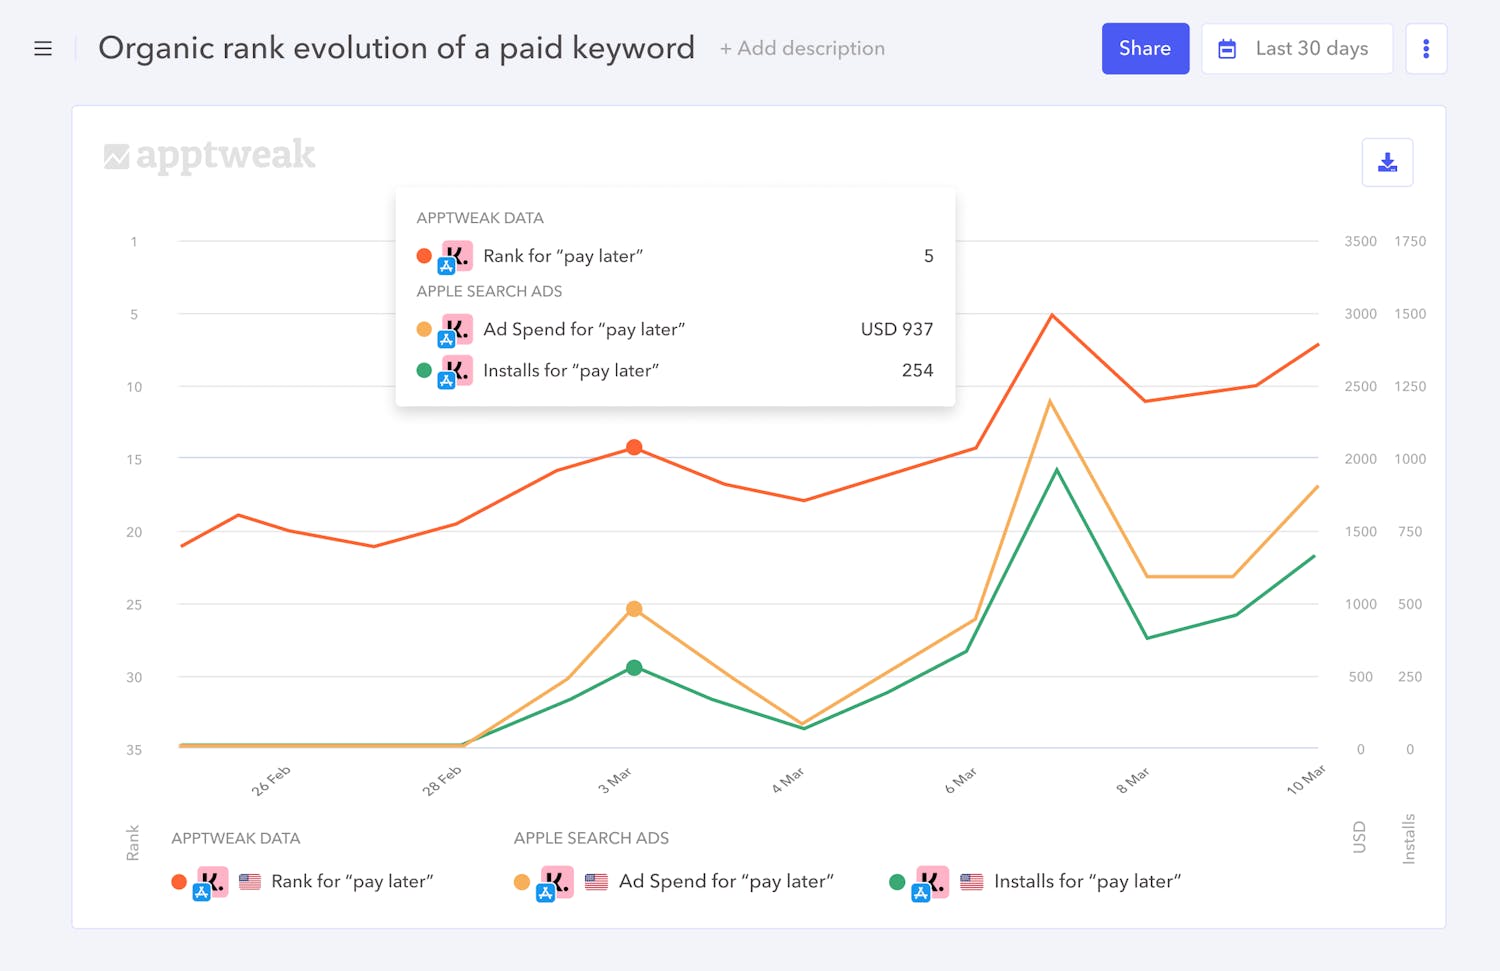
Reporting Studio allows you to visualize data up to the keyword level for Apple Search Ads. Then, combine this data with AppTweak to see organic keyword rankings on the same graph.
In the example above, we immediately see that Klarna’s organic ranking for the keyword “pay later” increased with its Apple Search Ads spend and paid installs for this keyword. To go a step further, we could then add organic downloads to understand the “organic uplift” potential of your Apple Search Ads campaigns.
Expert Tip
The synergies between ASO and ASA are a regular topic for app marketers. Measuring the exact impact of Apple Search Ads campaigns on your target keywords is a great way to understand how well the two concepts can be combined.6. Differentiate between organic vs. paid search installs
With Reporting Studio, you can also calculate the true number of downloads from paid acquisition vs. organic search by combining your Apple Search Ads (ASA) and App Store Connect (ASC) data.
Read our beginner’s guide to Apple Search Ads
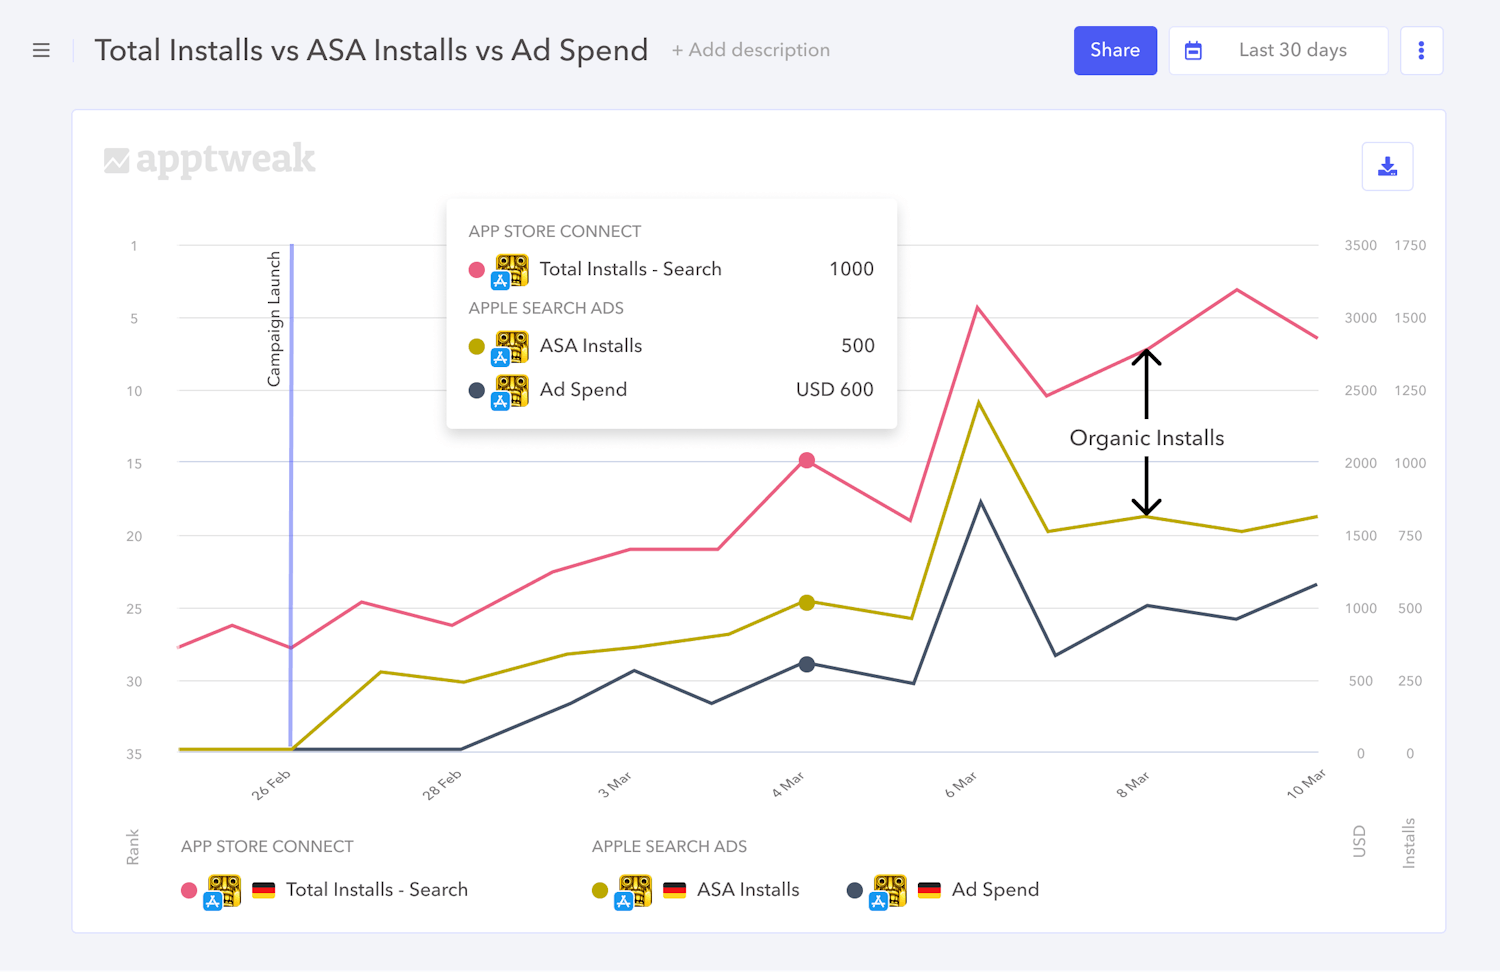
Start by selecting your App Store Connect data, and make sure to select the correct source type – “Search.” While App Store Search data combines installs from both organic and paid searches, calculating the difference between Total Installs from Search (App Store Connect) and your Apple Search Ads Installs will allow you to see and quantify your organic search installs – provided you’re not running campaigns elsewhere (i.e., on the Today tab, Search tab, or product page).
Expert Tip
Plotting Ad Spend on the same graph would allow you to track your Cost Per Install in Apple Search Ads quickly. Ideally, you’d want to see faster growth in your downloads than ad spend, or at least a similar growth rate. If, on the contrary, you see paid downloads growing slower than ad spend, this means your Cost Per Install is increasing and you might want to investigate if any campaigns are becoming too expensive for their download results.TLDR
Reporting Studio is a powerful AppTweak product dedicated to upgrading your app performance reports. With Reporting Studio, you can combine data across sources (AppTweak, your store consoles, MMPs, and more) to identify app store trends and more effectively prove the impact of your work.
In this blog, we highlighted just a few examples of custom reports you can build with Reporting Studio — however, the real possibilities are endless:
- Compare real app downloads with competitor estimates
- Plot category rankings on the App Store vs. Google Play
- Track keyword volume & search popularity across countries
- Monitor & compare brand awareness with competitors
- Measure organic uplift of Apple Search Ads campaigns
- Differentiate between organic vs. paid search installs
- And much more.
Leverage Reporting Studio today with an AppTweak Enterprise plan.



 Georgia Shepherd

 Lucas Riedinger

 Alix Carman

 Sukanya Sur