
App Power: Your New Performance-Based ASO KPI
The App Power is a signature performance-based ASO KPI that allows you to check any app’s “power” in both the App Store and Google Play and compare it with competitors, from any country!
Read on to know about this must-have ASO performance indicator.
Measure performance of any app
As an app marketer, ASO expert, or app developer, you’ve probably noticed how challenging it really is to measure an app’s performance in the stores.
Although various performance indicators exist today, it remains complicated to gather all the data together in order to measure the real strength of an app in the stores.
As an example, the app category ranking is indeed useful to gauge the popularity of an app in the stores. However, how can you really compare your app to your competitors if you’re not in the same category or sub-categories? How can you truly understand which app is the most successful overall?
To illustrate the issue described, try answering these two questions:
- Which app (A or B) is more powerful?
The first app constantly ranks #3 for 4 weeks in its category, while the second app ranks #1 for 2 weeks and then #5 for 2 weeks in the same category
- Which app (A or B) is more powerful?
One that ranks #2 in the News category for 4 weeks, and the second app ranks #20 in the Shopping category for 4 weeks.
Neither answers are straightforward. We will need to further investigate (apps’ ranking history, reviews & ratings, category competition, etc.) to come up with an answer.
At AppTweak, we strive to make your ASO work easier, faster, and more effective. This is precisely where our App Power indicator comes into play!
How does the App Power work?
The App Power is a score from 0 to 100 that indicates how powerful an app is in a given country, with 100 being the highest score and 0 being the lowest.
Apps with a high App Power have a strong visibility in the stores and a high download velocity.
To compute the App Power, our data scientists built an algorithm that takes various parameters into account including:
- The app’s category rank
- The competitiveness of that category
- The app’s download velocity (i.e. its flow of daily downloads)
- The competitiveness of the country
Leveraging the data we have accumulated at AppTweak across millions of apps in many different countries and industries, our data scientists have managed to measure the competitiveness of a category in a given store and country.
Let’s look back at our Question n°2. When writing this blog article, the app that was ranking 2nd in the News category (iOS – US) was Reddit and the app ranking 20th in the Shopping category (also iOS – US) was Poshmark. You would think that an app that ranks 2nd in its category is more popular than one that ranks 20th, but that would just be too easy. As a matter of fact, the Shopping category is one of the most competitive categories on iOS, with a high concentration of very powerful apps. That’s not so much the case for the News category.
So, which app drives more downloads? Reddit (2nd in News) or Poshmark (20th in Shopping)? Well, you’ve probably guessed the answer by now. Poshmark drives an average of 10k daily installs while Reddit is estimated to drive 7k daily installs.
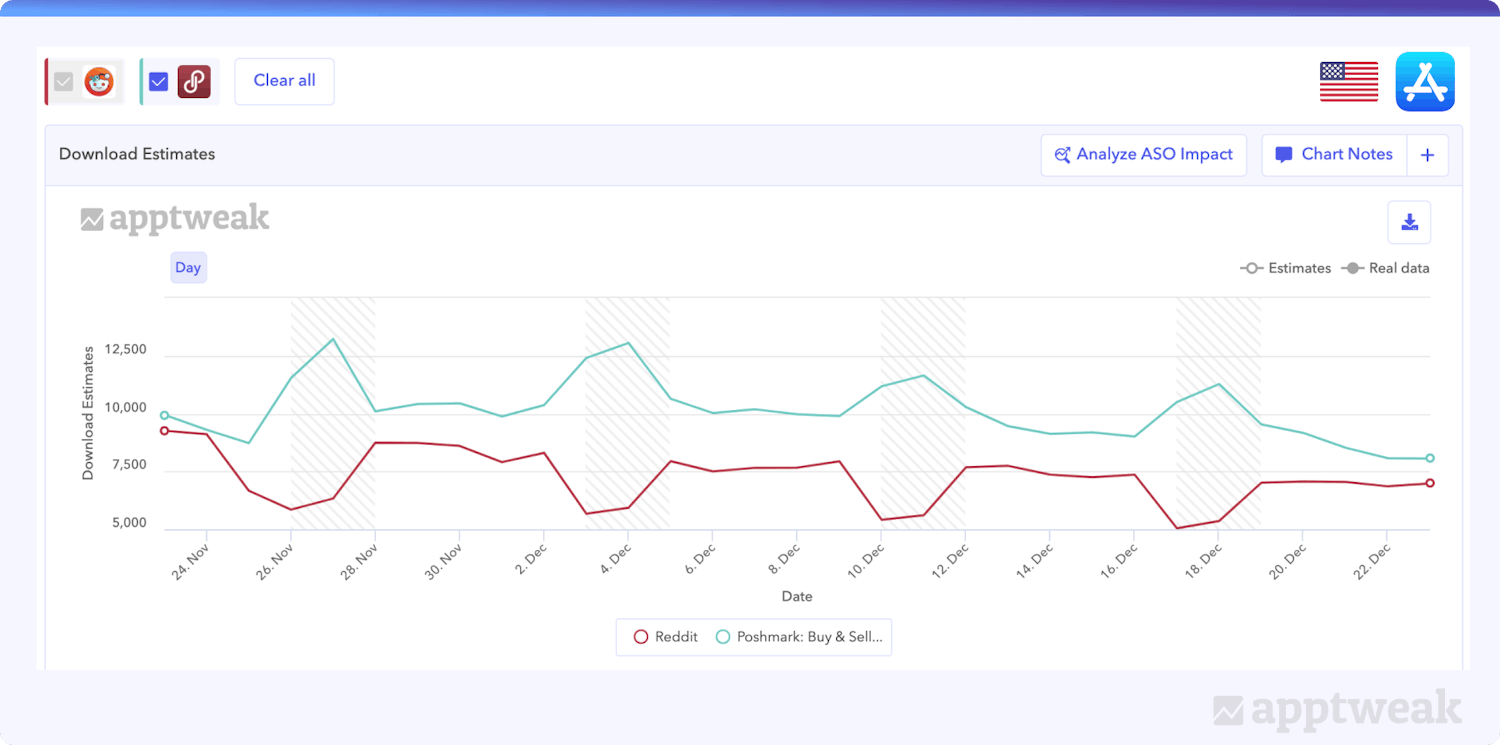
Comparing the daily downloads of Reddit (2nd in the News category – iOS US) and Poshmark (20th in the Shopping category – iOS US).
This example proves the point that it’s very difficult to compare the performance of apps that don’t rank in the same category, and that’s exactly why, at AppTweak, we designed the App Power. The App Power gives you an objective and accurate indication of any app’s performance in any given country, whatever the category it ranks in.
How can we measure the competitiveness of a category?
One way to assess the competitiveness of a category is to look at how many apps of that category rank in the “All” category (and similarly, in the “Games” category for games).
Our research on the matter has shown that download velocity (the flow of daily downloads that an app drives), is a key influencer on how an app ranks in a category, both on the App and Play Store. In other words, the apps that drive the highest amount of daily downloads on the App or Play Store will be the top apps in the All category and in their respective category. These are the apps that we will call “powerful” apps.
How Many Downloads Does Your App Need to Reach Top Rankings?
Some categories tend to have a higher concentration of powerful apps than others, making them more competitive. As a result, apps in those categories will need a higher flow of daily downloads to reach top ranks as opposed to other categories where the concentration of powerful apps is lower. The analysis below compares the concentration of powerful apps across categories, ranking them from most to least competitive in their respective stores.
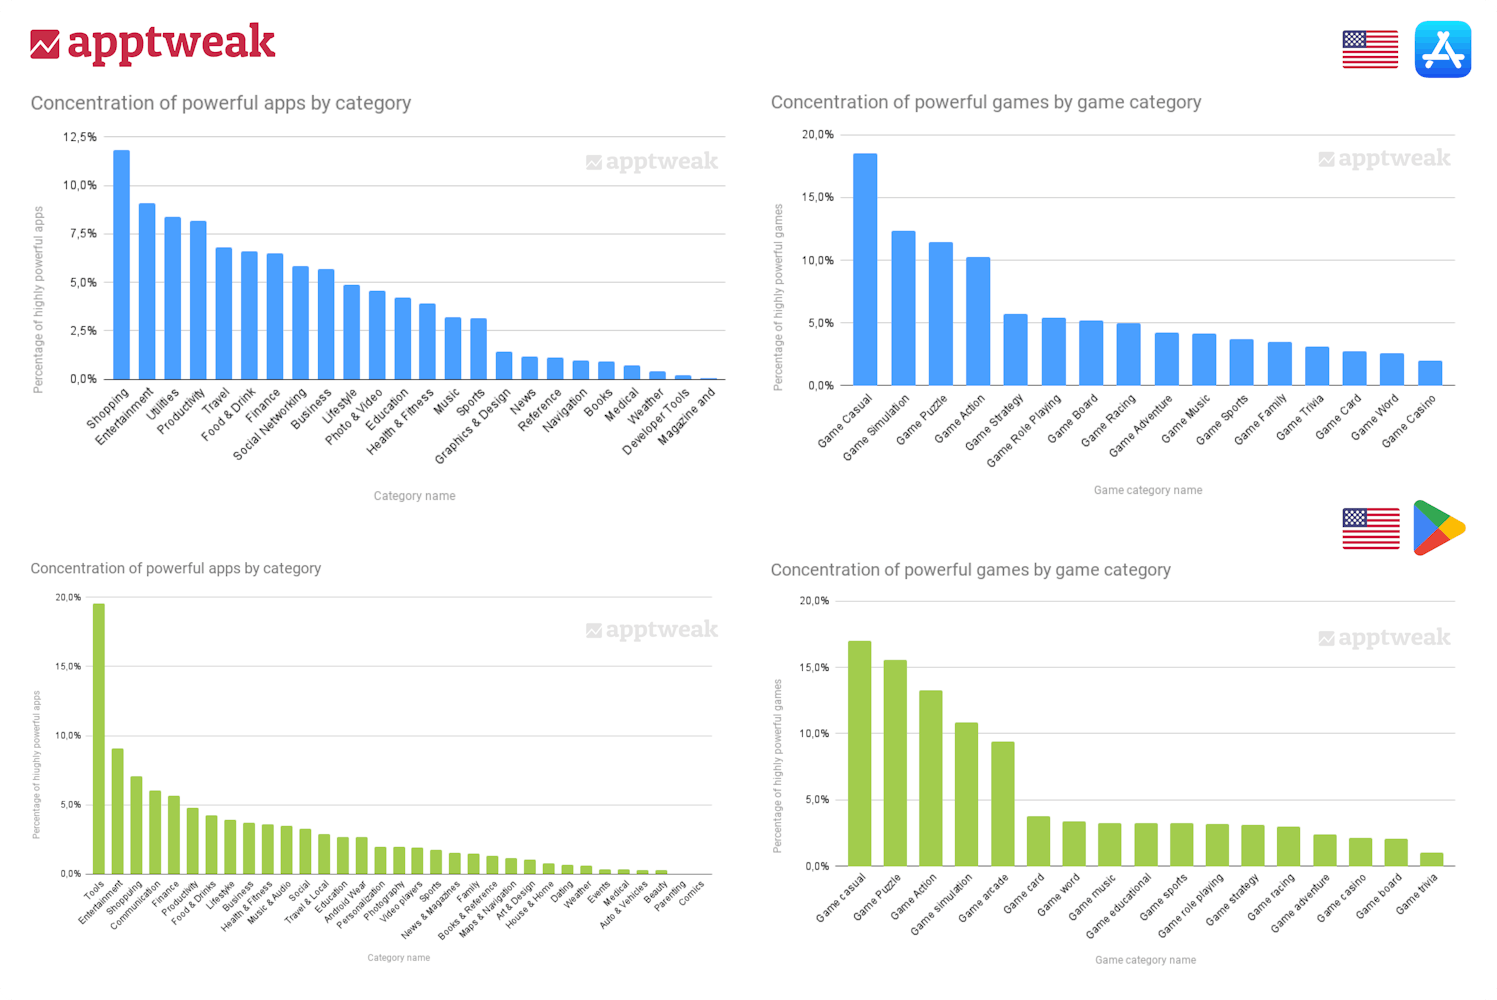
Comparing the competitiveness of app and games categories in the US Apple App Store and Google Play Store
The analysis above immediately shows some key insights:
Insights regarding the App categories:
- The Entertainment category is the 2nd most competitive on both the App and Play Store
- The Tools category is by far the most competitive on the Play Store, with a concentration of highly powerful apps twice as high as Entertainment. Its equivalent iOS category Utilities is the 3rd most competitive in the App Store.
- The Shopping category is also highly competitive in both stores, reaching 1st position on the App Store and 3rd position on the Play Store.
Insights regarding the game categories:
- The Game Casual category is the most competitive in both stores, with a significant gap on the App Store.
- The other most competitive game categories are Puzzle, Action, and Simulation. All ranking in the top 3 behind Casual on both stores.
Top Chart Trends: Leading Apps & Games on the App Store
Using App Power in your ASO routine
The App Power is a great metric to compare your app’s performance with others. Your goal is not to reach a score of 100, but rather to reach similar levels as your competition. It is important to interpret this indicator with caution, a “low” score can already be a great achievement for your app and may be enough according to the objectives you have set.
How should I use the App Power?
We recommend using the App Power to benchmark your app against competitors. Do your competitors have similar App Powers as your app? Which of them have the highest App Power? How far ahead are they?
The App Power can also help select the apps you want to add to your competitor set. We recommend adding apps with similar App Powers as competitors. Apps with extremely high App Powers might have a very different level of marketing budget, brand awareness or international presence. Apps with very low App Powers tend tobe apps with very little traffic. In both cases, they might not be relevant apps to benchmark yourself against.
How can I increase my App Power?
Increasing your App Power will take time, it is not an indicator that you can act directly upon. Any efforts that will boost your app’s visibility and increase its daily downloads will have a positive impact on your App Power. Discover below a few concrete examples of insights on how to best use the App Power and when to use it.
Sign up for a free trial and have a look at your App Power right away!
Compare global performance
Let’s take for example the Skyscanner app, to which we have added 3 main competitors: Expedia, Hopper, and Kayak.
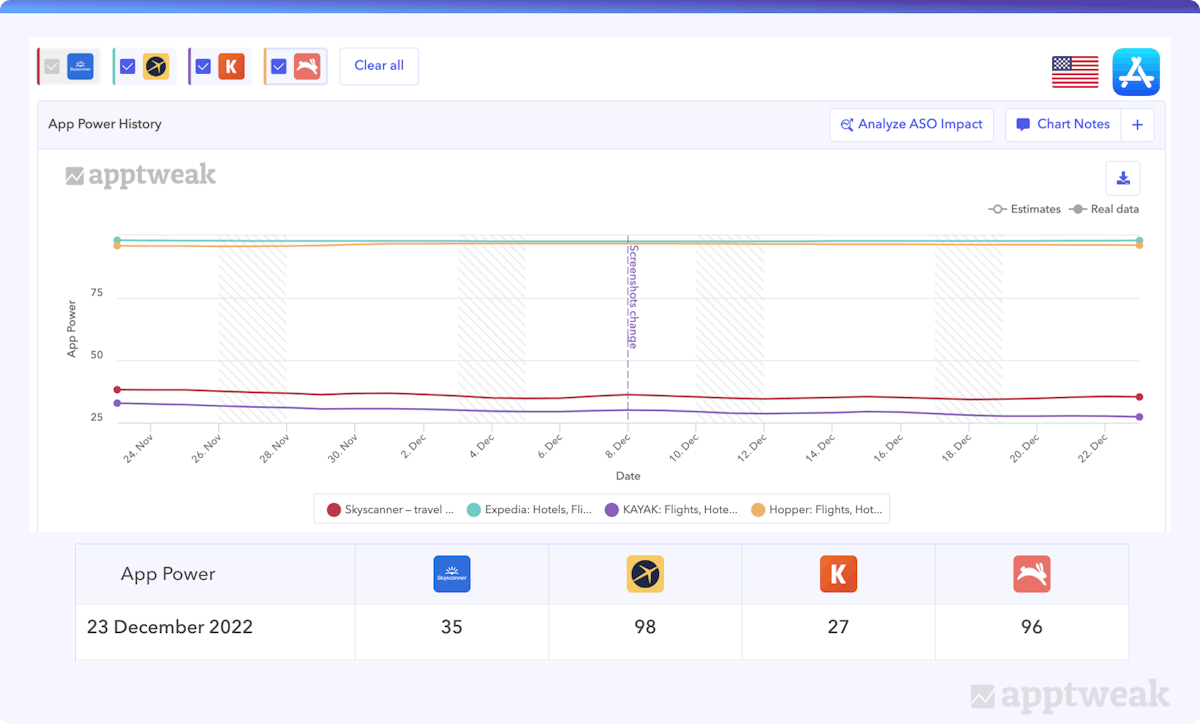
As we can see, in the US, Skyscanner has an App Power of 35, which is 2nd lowest in this case. Expedia is the most powerful app with an App Power of 98, closely followed by Hopper with 96. Kayak is the least powerful app with an App Power of 27 in the US.
Now, let’s take a look at the same app, with the same competitors but in the UK:
Skyscanner has a higher App Power (95) than in the US, and is the 2nd most powerful app of the series, just behind Hopper. Expedia, which was first in the US, is now in 3rd position with an App Power of 76. Kayak remains the least powerful app.
As a third example, let’s take the same configuration in France:
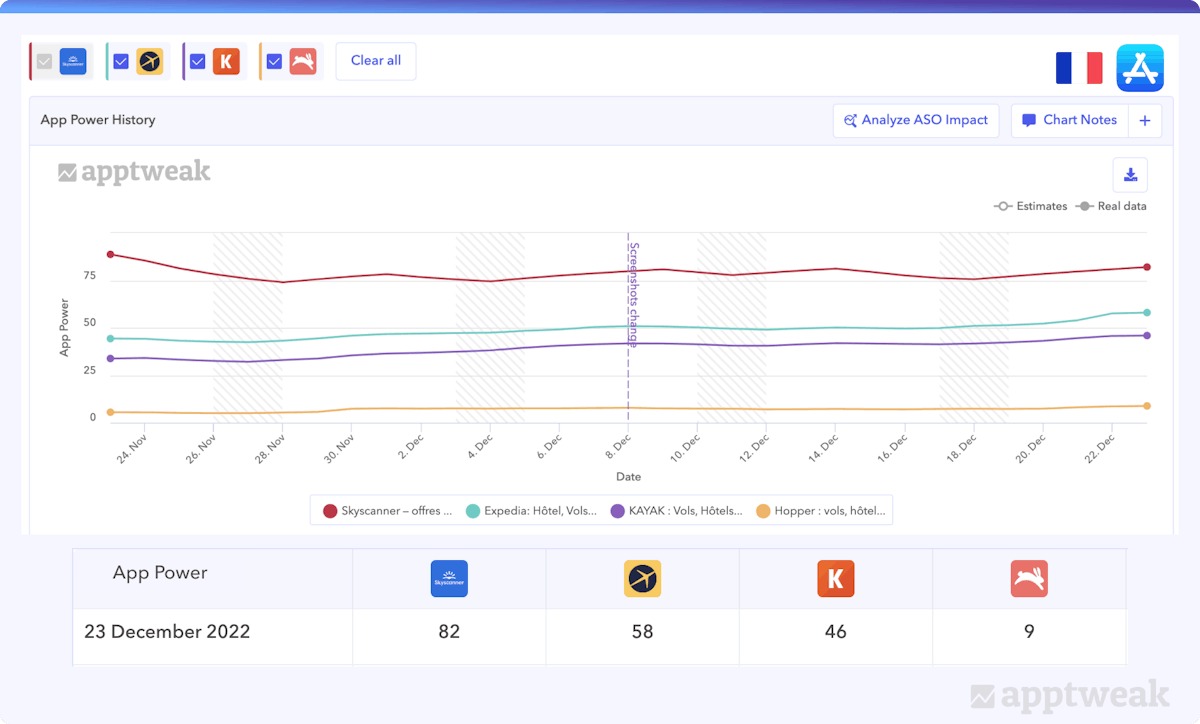
Skyscanner has an App Power of 82 and is now in 1st position by far. Expedia is 2nd with an App Power of 58 and Kayak is now in 3rd position with an App Power of 46. This time, Hopper is the app lagging behind with a very low App Power of 9.
This clearly highlights the fact that an app has more or less power given the country.
While Expedia and Hopper are very powerful in the US and the UK, this isn’t so much the case in France. Skyscanner seems to have a good presence in Europe, with a high App Power in France and the UK, but there is significant room for improvement in the US.
Did you know? You can also compare the download & revenue estimates of any IOS app on AppTweak!
App Power allows you to compare two apps in two distinct categories
Another interesting insight you can get out of the App Power is the ability to compare various apps with each other, even if they’re not in the same category.
As you know, some categories are more competitive or volatile than others, requiring more or less downloads to achieve the Top 50 for example.
Let’s take a look at Dating apps. On the App Store, there is no dedicated category for Dating. As a consequence, dating apps tend to register either in the Lifestyle or the Social Network category, making it difficult to compare their performance.
Gain Advanced App Store Insights with New AppDNA Taxonomy
For example, Bumble, Badoo, Hily, and PlentyofFish are all dating apps, but Bumble and Badoo rank in the Lifestyle category while Hily, and PlentyofFish rank in the Social Networks category.
Although the apps aren’t in the same category, it is obvious that they are ASO competitors and probably are stealing some organic downloads from one to another. Therefore, it is very useful to be able to benchmark their performance using the App Power.
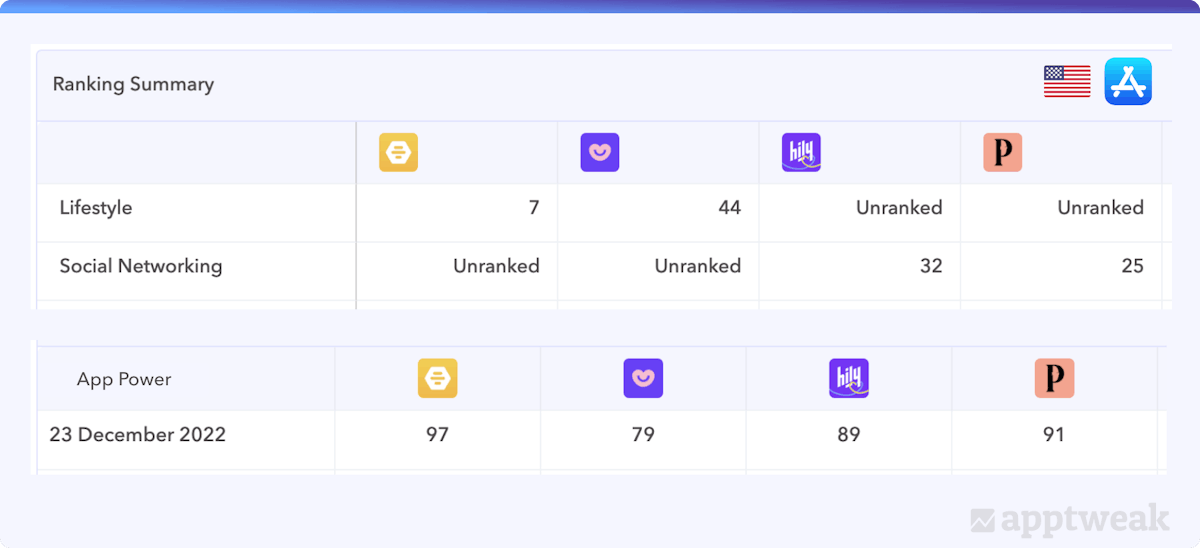
How the App Power makes it easier to compare competitor apps that aren’t registered in the same category
Key point: By taking into account category competitiveness, the App Power helps you compare the power of an app with its competitor(s) even when they don’t rank in the same category.
Check out your app’s category ranking in our Top Charts Free Tool!
Measure an app’s performance in the long term with App Power
Last but not least, the App Power provides an accurate indication of the success of an app globally over time.
As we know, category rankings are very volatile and often fluctuate. For instance, it is not always easy to compare a just-launched app or a trending app with an app that has over 2 years.
Thanks to our app power indicator, you can now effectively measure an app’s performance objectively and understand its real strength.
Let’s look at the gaming industry. We know that some games can be very popular but for a very short time. We compared 4 games: Subway Surfers, Knife Hit, ASMR Simulator, and Brawl Stars. If we look at their category ranking, we can deduce the following:
- Subway Surfers and Brawl Stars are established apps, with historically higher ranks in the Game Category.
- Knife Hit and ASMR Simulator are trending apps and have recently overtaken Brawl Stars in the Game Top Charts.
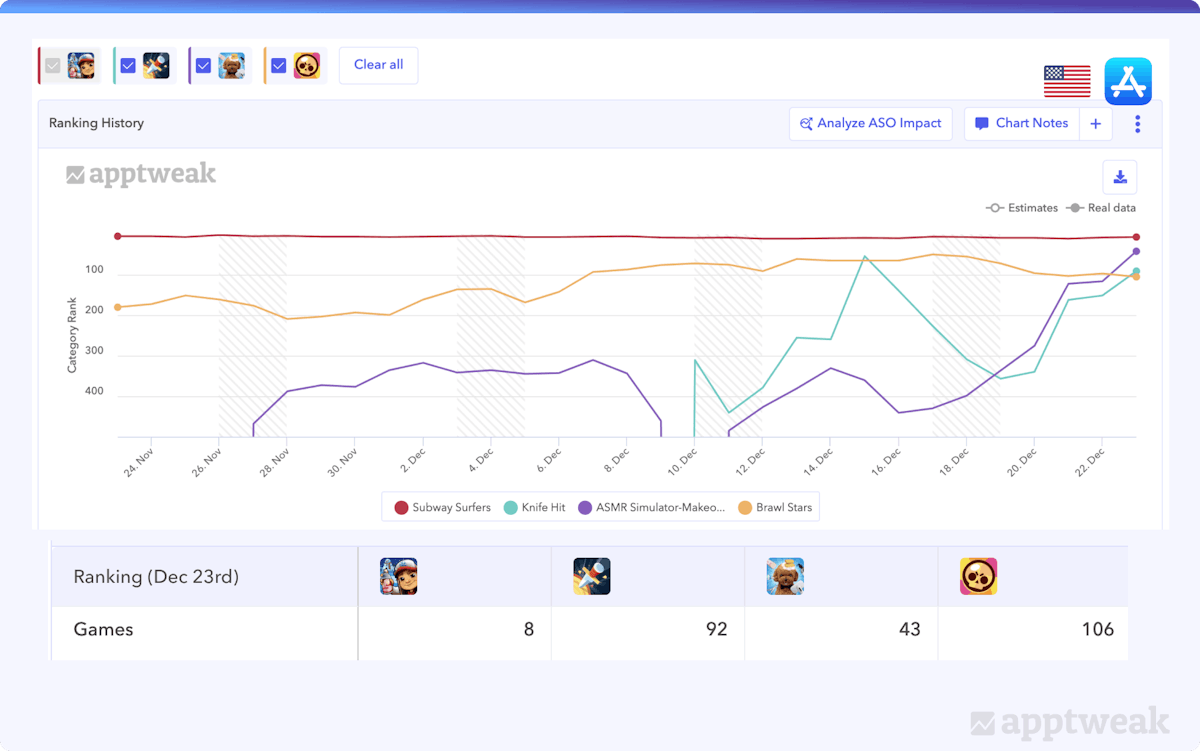
However, when evaluating the power of an app, it is important to take historical data into account. For this reason, our App Power takes into account the ranking history of an app so as to reflect lasting trends as opposed to short term hypes.
If we look at the App Power of the apps depicted above, we can clearly see that the App Power of the trending apps gradually increases, but Brawl Stars is still way ahead.
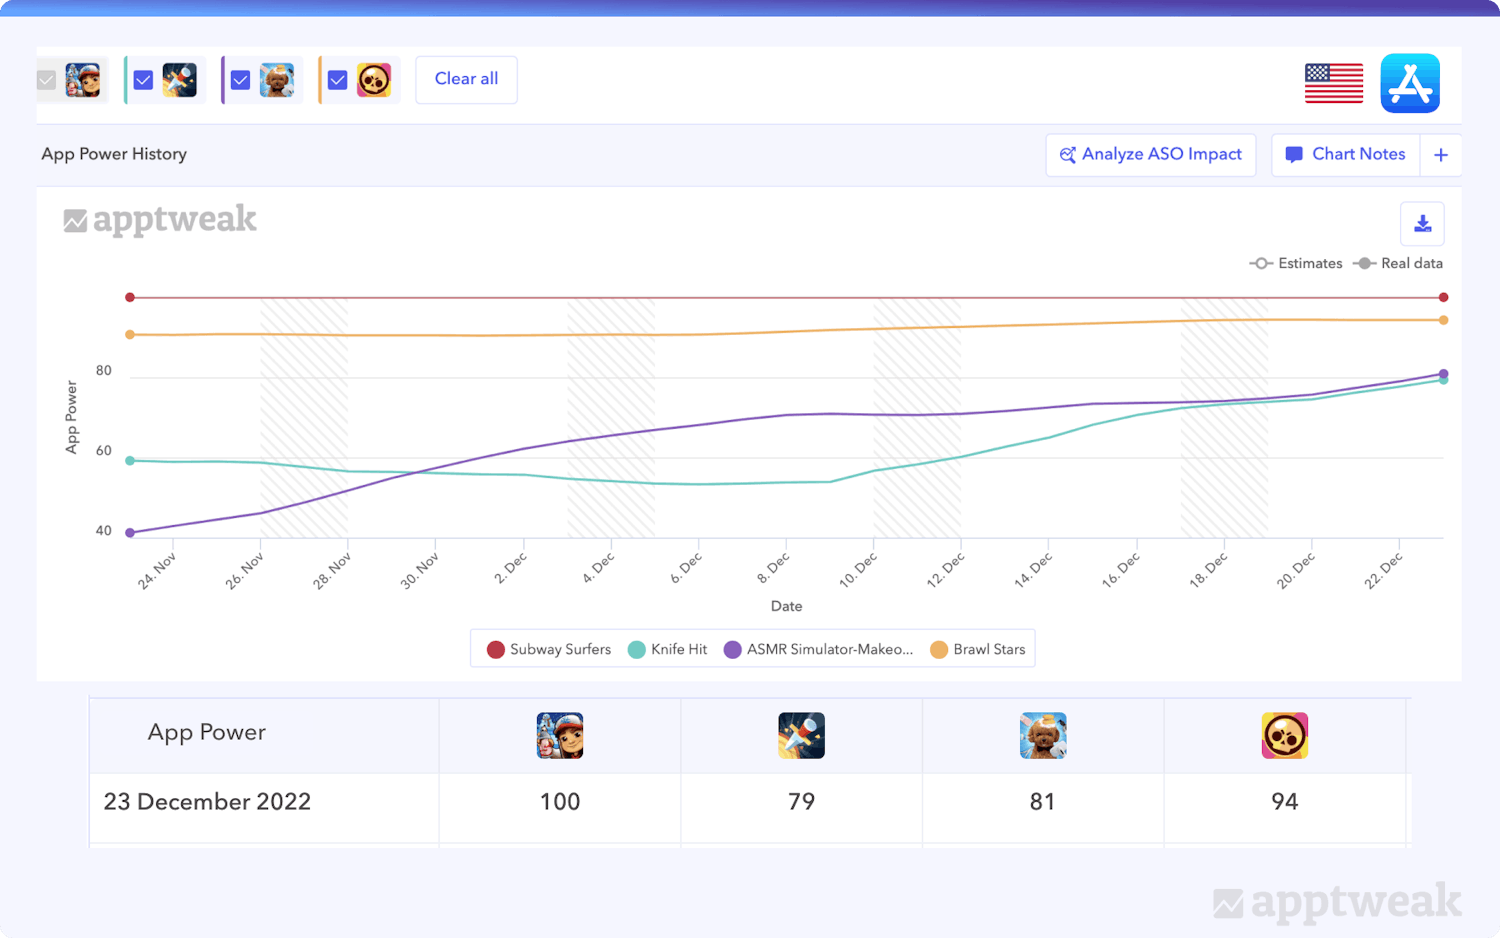
The growing App Power trend for Knife Hit and ASMR Simulator is a clear indication that these games are gaining in popularity and that this is a lasting trend and not a hype.
As a comparison, the next example shows an app that has a sudden ranking increase but quickly came back to its initial ranking.
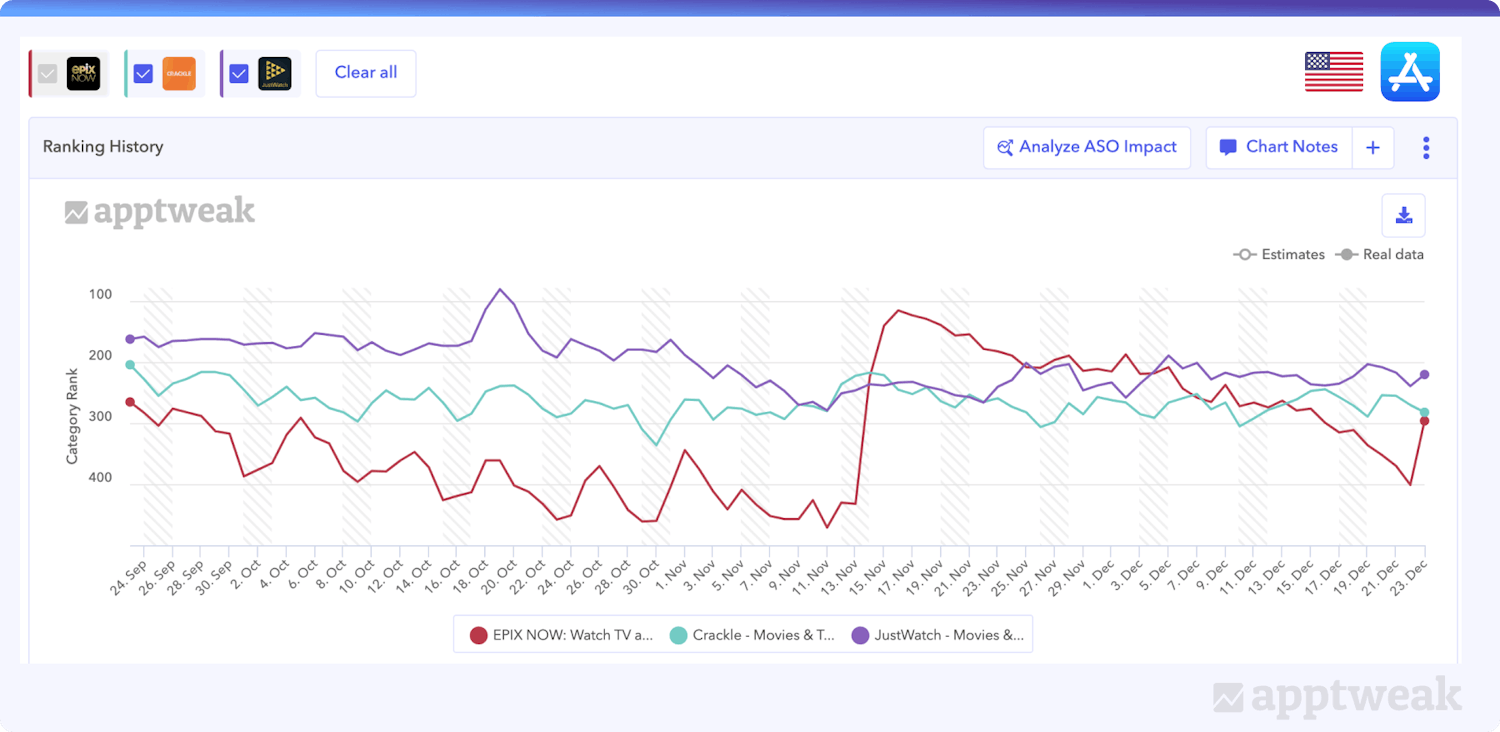
As we can see below, the App Power only shows a gentle progression around the days of the ranking spike but doesn’t seem to be very much affected.

Key points: the app rankings can be very volatile while the App Power depicts the app performance over time, lowering the effects of short-lived increases (or decreases) of an app’s rankings.
App Power vs ASO Score
The App Power and the ASO Score are not to be confounded. While the App Power gives an indication of the power of your app in a given country, the ASO Score shows how optimized your app is from an ASO perspective.
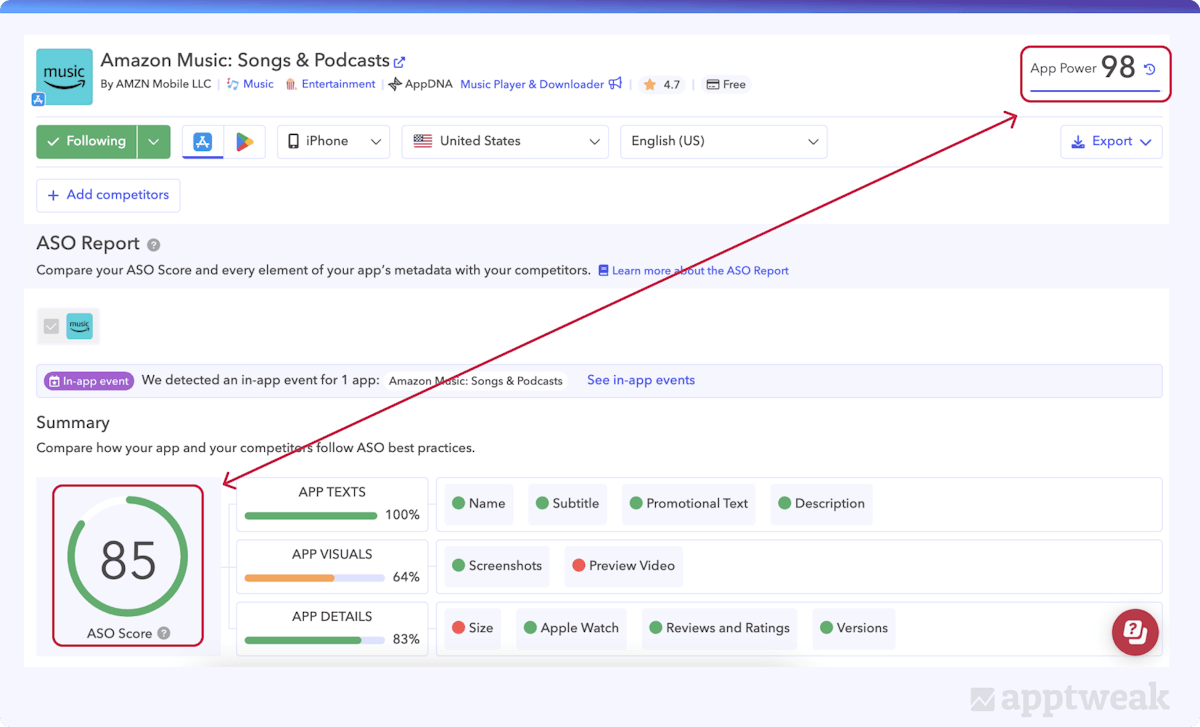
ASO Score vs. App Power: The ASO Score indicates how oprimized your app’s metadata is, while the App Power measures the power of your app in a given market.
A high App Power indicates an app with a high number of downloads. A high ASO Score indicates an app that has thoroughly implemented the best ASO practices in its metadata.
An app can have a high ASO Score but a low App Power if the app is fully optimized for ASO but doesn’t have a huge traction. This can be the case for very niche apps or recently launched apps.
If the app drives a lot of traffic without focusing on ASO. it can have a high App Power but a low ASO Score. This is the case of extremely popular apps with a very strong brand that makes them less sensitive to ASO.
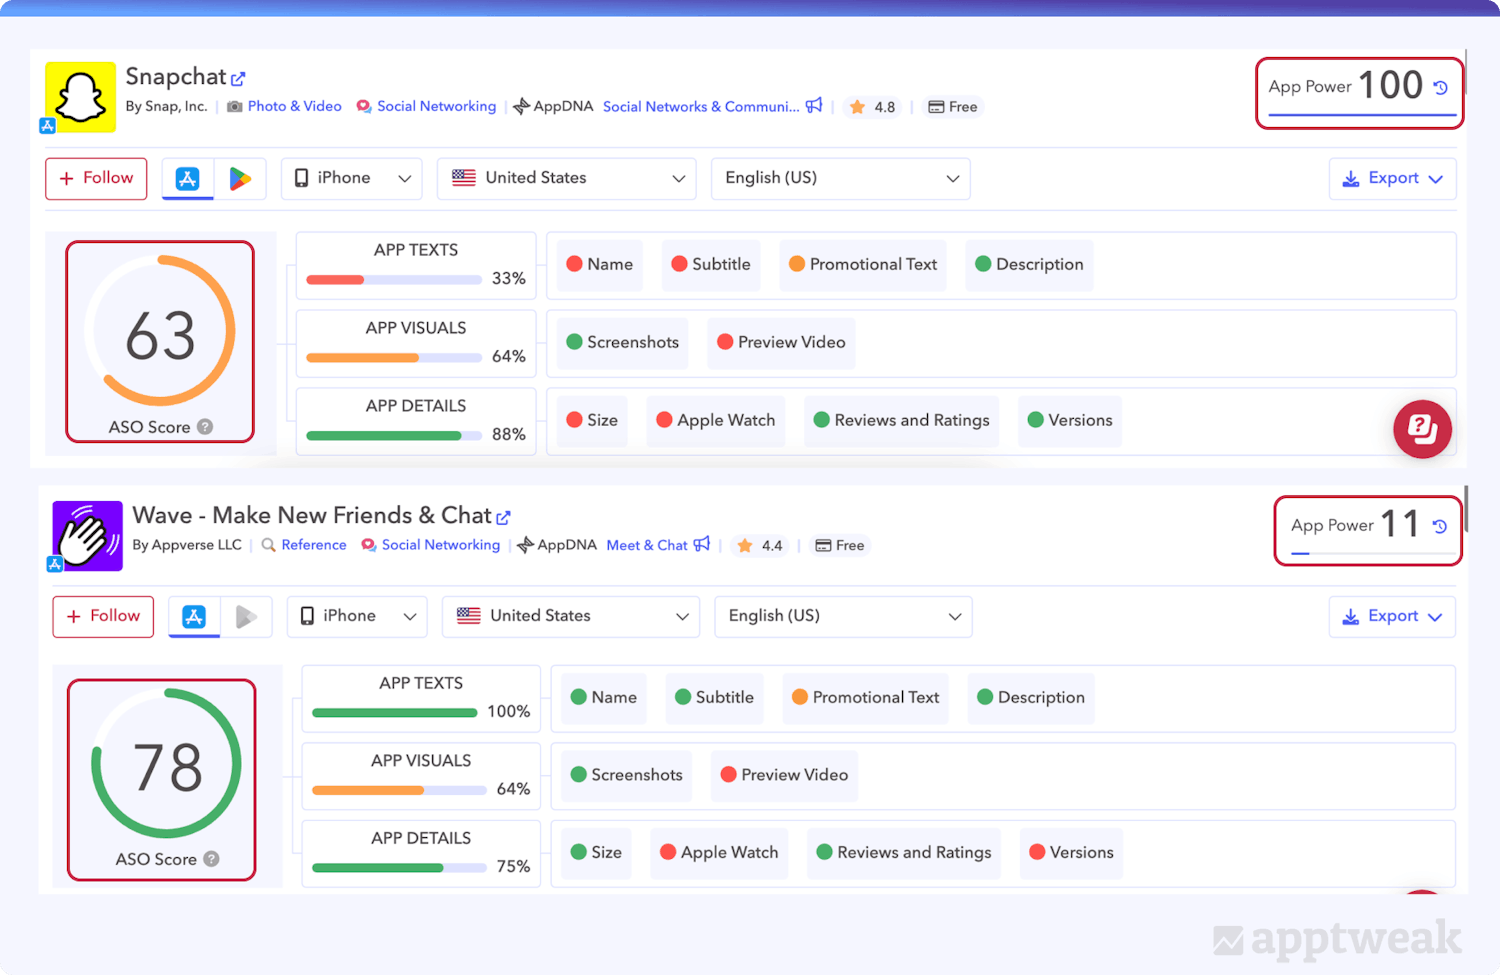
Apps can have a high App Power but low ASO Score and vice versa
ASO Score
As an ASO practitioner, you have a direct impact on the ASO Score of your app. Follow the best practices described in the ASO Report section of your app to rapidly increase your app’s ASO score. However, increasing your App Power will take more time and depends on the traction your app manages to build.
As a reminder, here’s the ASO Score definition: The ASO Score shows to what extent the app follows the ASO guidelines. To improve the score of an app, you should solve all items in the report marked with a red dot.
It purely and simply indicates if an app is following Apple’s or Google’s guidelines in terms of metadata best practices (e.g: length of the app title, usage of screenshots, etc.). It is not an indicator of an app’s performance — you have the App Power for that now!
Last word
This new ASO performance indicator is going to change the way you conduct your ASO analysis and competition benchmark.
Not only it’s going to facilitate your ASO work, but it’s also helping you monitor effectively the global performance of any app, across countries and compare apps from different categories with each other.
Attention: Please use this indicator carefully and understand that achieving a high App Power indicator score shouldn’t be your end goal.
Also, we ran multiple experiments and we found that 80% of apps with an App Power above 80 are Games. This undisputedly highlights the prevalence of games as the most successful apps on the App Store.
Finally, remember, the App Power score is an AppTweak-only indicator.
Sign up for our 7-day free trial to access this massive pool of data and conduct your market research.


 Georgia Shepherd


 Olivier Verdin

 Jonathan Frisch

