Discover the Number of App Installs Per Keyword
We know you’ve been waiting for this. We’re very proud and excited to announce that we’ve just released an amazing new indicator that finally tells you how many installs a keyword brings to your app! Depending on the keyword volume and on how your app ranks on the keyword, we’ve managed to compute an algorithm that estimates the number of downloads a keyword drives to any application in the US. All details below!
Discover the number of installs a keyword drives to any app
You might be thinking: Isn’t this what Google already shows in the Google Console? Well, it’s actually better than that. Google indicates how many installs a keyword drives to your app worldwide. That means that if the word is your brand name, you have no idea what the split per country is.
On AppTweak, we estimate the number of installs driven by a keyword in the US specifically (we’re already working on extending the formula to other major markets). Moreover, our estimations are available for your app but also any other app in the App Store.

In just a few clicks, you can check which keywords bring the most organic downloads to your app. You can do exactly the same for your competitors in order to get an idea of which keywords are most valuable for them.
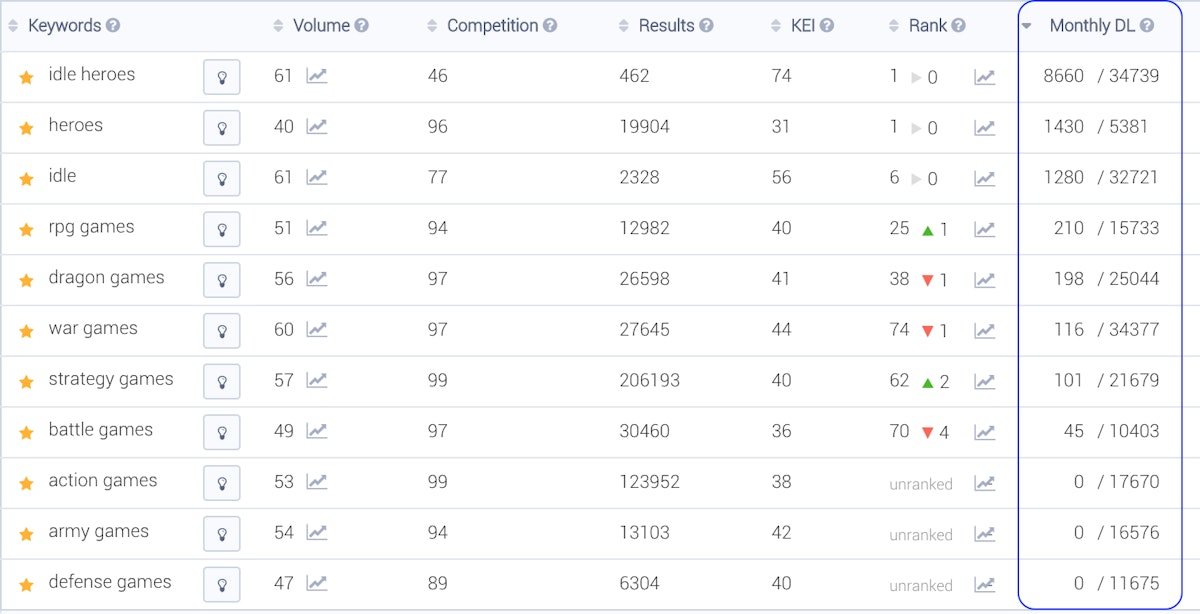
 Number of monthly installs driven by a set of keywords to the mobile game Idle Heroes (App Store, US).
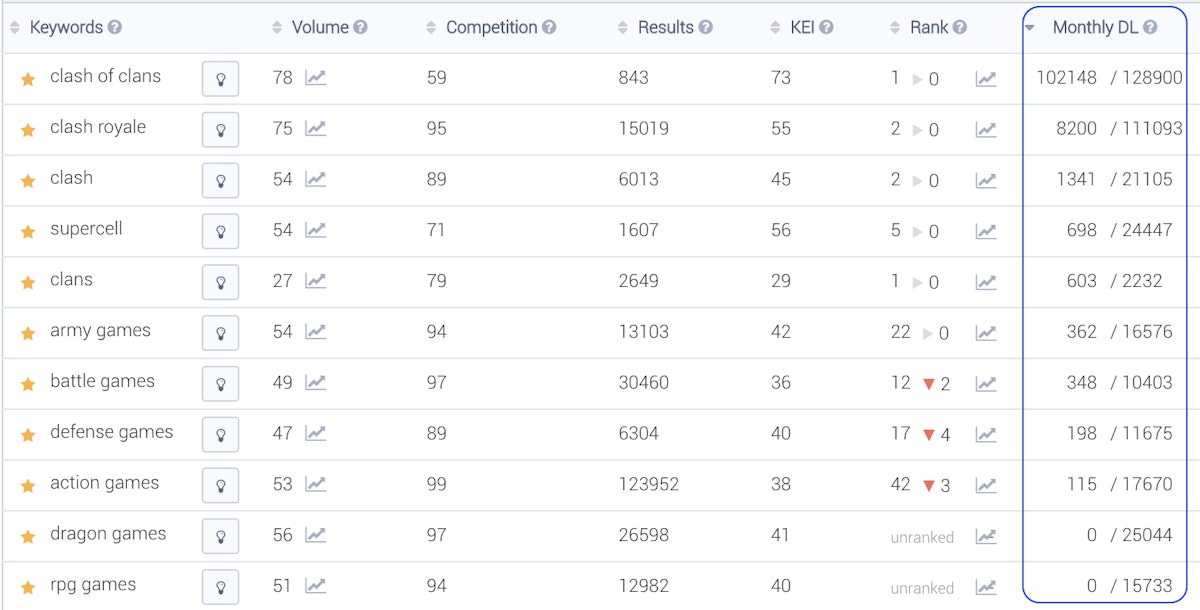
When we compared a set of keywords and the installs they drove to the games Clash of Clans and Idle Heroes, we found that both games had their branded terms in their top keywords. When we looked at a set of generic words, we found that Clash of Clans performs better on words such as “army games” or “action games,” whereas Idle Heroes gets more installs from keyword like “rpg games” and “dragon games.”
Optimizing your app title using Brand vs. Generic keywords
Discover total installs a keyword drives across all apps in search results
In addition, AppTweak also indicates the total number of organic installs that a keyword drives across all apps in the search results. This is a great insight to have an idea of the portion of total installs your app is getting.

Comparison of the monthly installs generated by the words “clash of clans” and “clash royale” to each associated mobile game (App Store, US).
We compared the portion of total monthly installs the games Clash of Clans and Clash Royale were getting from each other’s branded keywords, since both apps rank on the 2nd position for the other’s game name. As you can see from the numbers, each game reaps more than 70% of the total monthly installs when the keyword corresponds to their game name. However, when it’s the other’s game name, that portion falls down under 10%.
Additionally, the total monthly installs of a keyword is also a great indicator to compare keywords with different volume. You can get a better sense of the total number of potential installs that is behind a Search Popularity score. This can be insightful when comparing brand names – you can now know how much traffic a brand name can drive versus another. When it comes to choosing between two generic terms with different volumes, you have now an idea of the potential number of installs you’ll be losing if you target a lower volume keyword.
Total monthly installs generated by popular mobile game brands (App Store, US).
Using AppTweak’s total monthly installs indicator on mobile game brand keywords, we could compare the popularity of major games in the App Store, US. Supercell games like Clash of Clans and Clash Royale seem to drive twice the traffic of “empires & puzzles” and 4 times more traffic than “idle heroes.”
Check out 2018’s top Mobile Apps & Games
How AppTweak estimates the number of installs per keyword and app
In order to compute this estimation, we used the data from thousands of apps that have connected their Google Console and App Store Connect to AppTweak. By aggregating the installs per country and per keyword, and by adding various elements into the formula, our data scientists could put together a powerful estimation algorithm. As usual, we love sharing everything with you, so here are the main elements we have used in the formula:
Impact of keyword volume on total installs
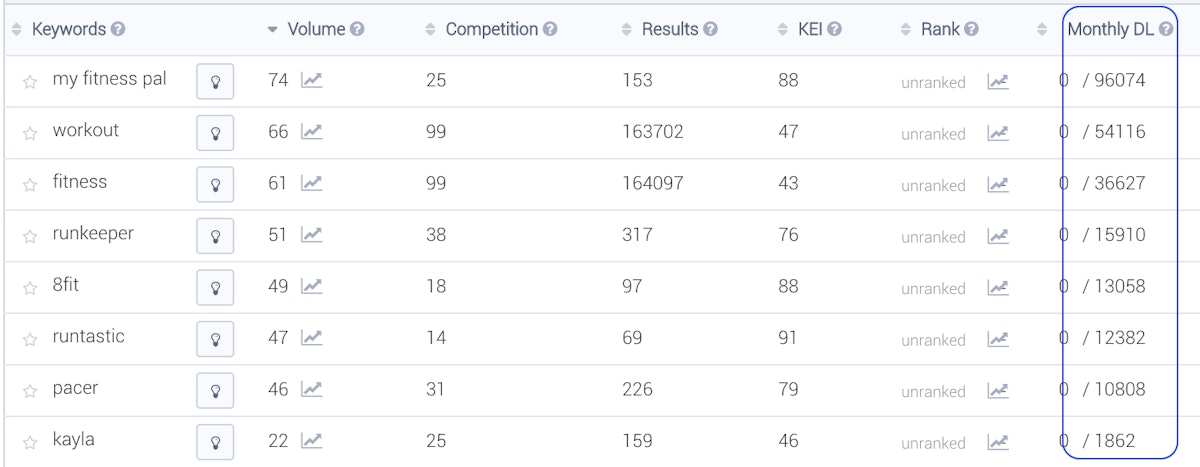
The keyword volume is obviously a major element in the formula. The higher the volume of a keyword, the higher the total installs it can potentially drive. As mentioned earlier, you can now compare keywords with volume differences and see how the gap translates in terms of installs. In the following example, you can see the differences in terms of potential monthly installs between several fitness apps’ brand name:
 Number of total monthly installs driven by a set of fitness-related keywords with different volumes (App Store, US).
All you need to know about Apple’s Search Popularity and how to interpret it
Impact of app ranking on app installs
Another crucial element in determining the number of installs a keyword drives to your app is the position of your app on that keyword. Using numerous data we’ve collected, we could estimate the portion of total downloads an app reaps according to its rank on that word. Here again, you can compare with your competitors and see which keywords bring them most installs. You might, therefore, find interesting keyword opportunities that could be worth targeting.
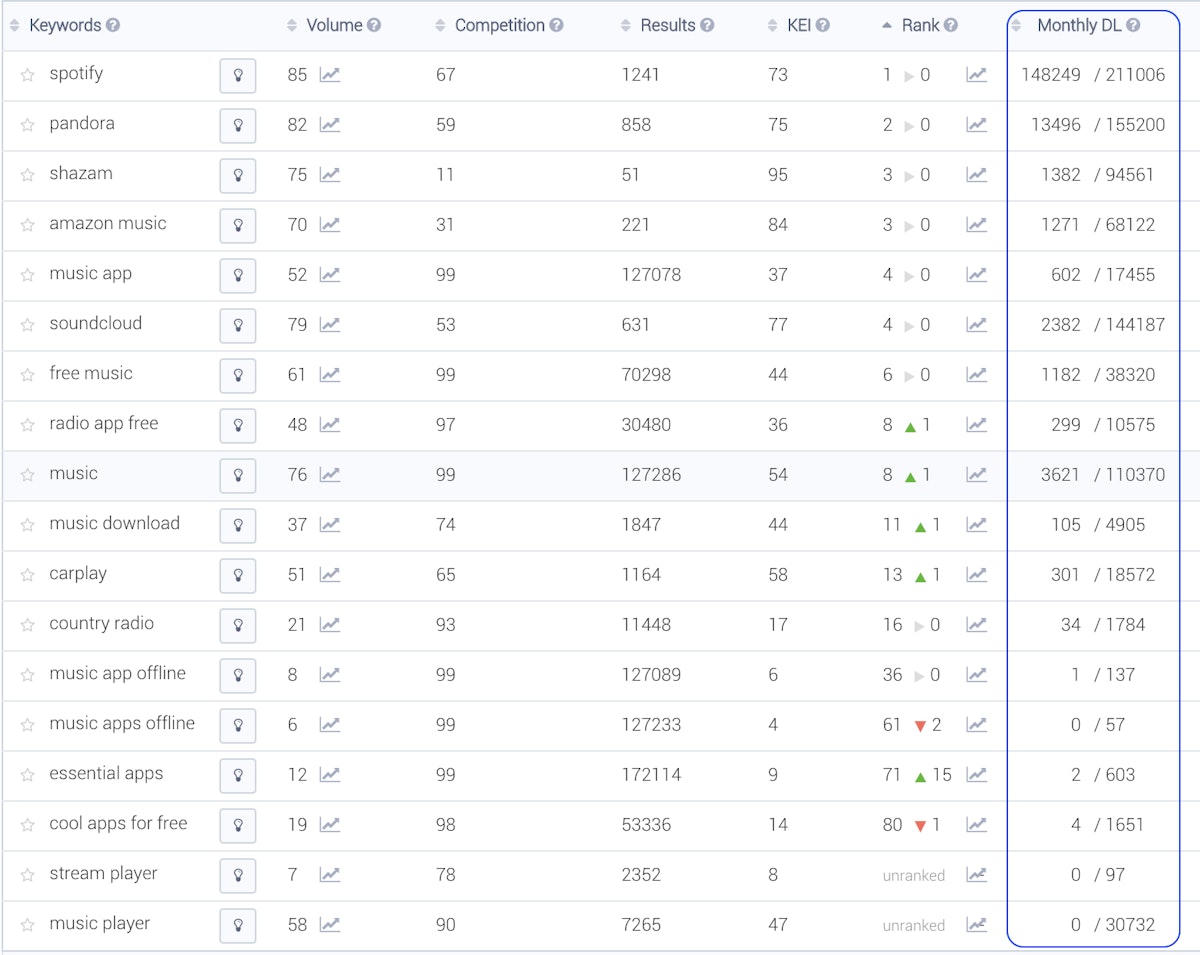
 Number of monthly installs driven by a series of music-related keywords for the Spotify app (App Store, US).
We had a look at a list of keywords for which Spotify has different rankings in the App Store, US. It’s interesting to see how volume and rank put together can affect the number of installs a keyword drives to an app. This view can help identify keyword opportunities.
For example, Spotify ranks at 13th on “carplay,” which only drives 301 installs per month to the app. Pandora, a direct competitor, ranks 3rd on the keyword, which drives nearly 600 monthly installs. Sirius XM, the app that ranks 1st on “carplay,” receives about 3000 installs per month from that word!
Monitor your app’s ranked keywords and estimated installs from keywords
Impact of branded terms on app installs
Finally, another important element we added to the formula is considering if the keyword is a brand name or not. This can have a huge impact since users searching for a brand name are very likely to download the app that has that brand name. Another app that ranks in the 2nd position on that branded term will probably convert much less than if the keyword was generic.
 Number of monthly installs driven by a brand vs. a generic term for DoorDash (App Store, US).
On its brand name, Doordash gets more than 80% of the total estimated monthly installs. However, on a generic keyword like “food delivery” (for which it also ranks #1), the percentage is much lower since users don’t have a specific app in mind when performing the search and are more likely to scroll more.
Check out the keywords that bring most installs to your app now
You’re all set to have a look at those highly valuable numbers yourself! We can’t wait to hear your feedback! Please feel free to share some love and share the news to your network.
Note: For the moment, this feature is only available in the United States. Of course, our data scientists are already busy extending it to other geographies and further fine-tuning these estimations. Stay tuned 🙂


 Georgia Shepherd


 Olivier Verdin

 Jonathan Frisch

